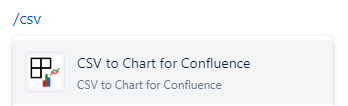
Start typing /csvand select CSV to Chart for Confluence
Select the Edit pencil icon

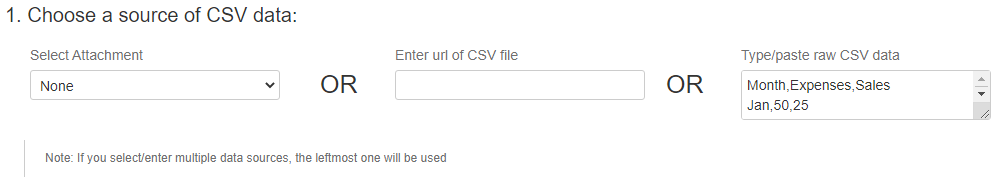
Choose your CSV data by either:
Selecting an attachment
Entering a URL
Typing or pasting in the CSV data
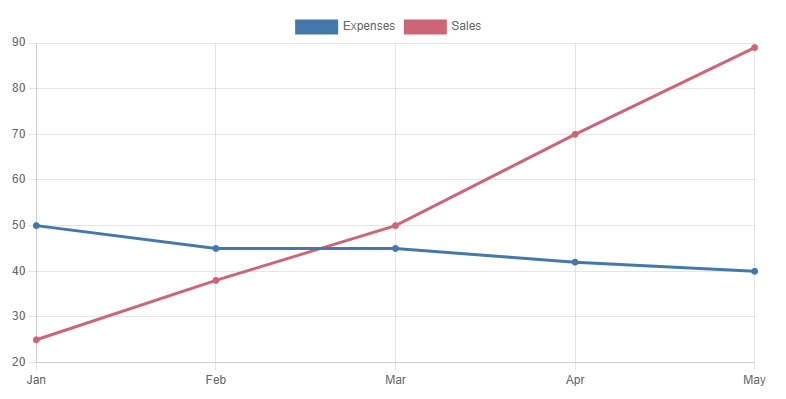
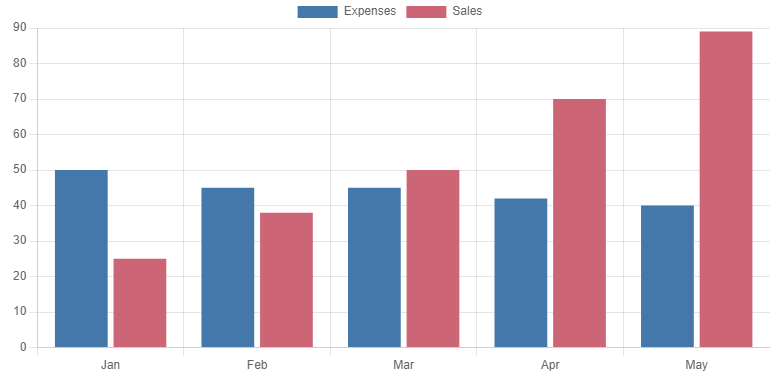
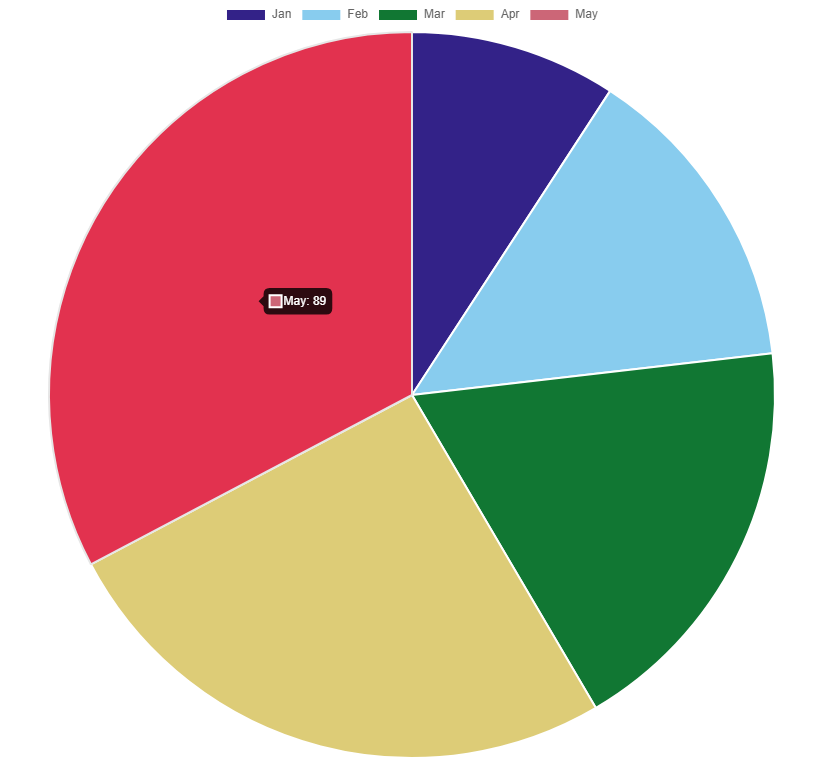
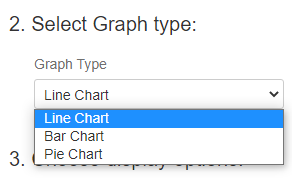
Choose which type of chart you want, a Line Chart, a Bar Chart or a Pie Chart
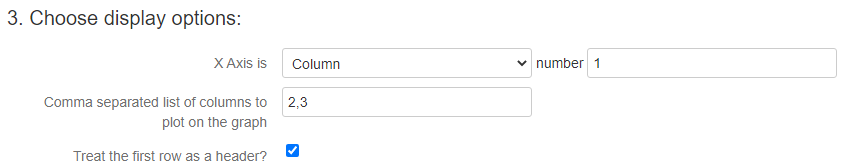
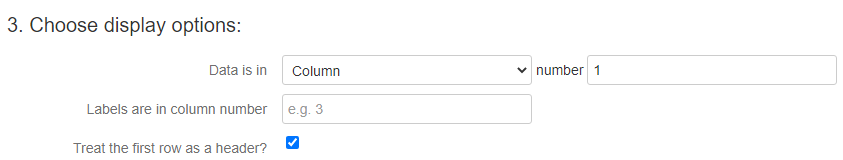
Choose exactly which parts of your CSV data you wish to display. You will have different choices for Line and Bar charts versus Pie Charts.
Press Save

Your chart will be displayed. Here are some examples: